Creating a Dashboard
You do not need to be technical to build a dashboard. Pick a ready-made panel, answer a question or two, and it appears on the page with your figures.
Start the dashboard
- Go to Stats in the left-hand menu to open the dashboards list.
- Click New Dashboard.
- Give it a name and click Create.
The name is what you and your team will pick out of the dashboards list, so make it say what the dashboard is for. "Monday Morning", "Cashing Up" and "How Full Are We?" all beat "Dashboard 2". A new dashboard is not pinned to the Stats menu until somebody stars it.
You land on an empty dashboard offering one Add your first panel button. Add Panel, at the top right, does the same job and is where you will go for every panel after this one.
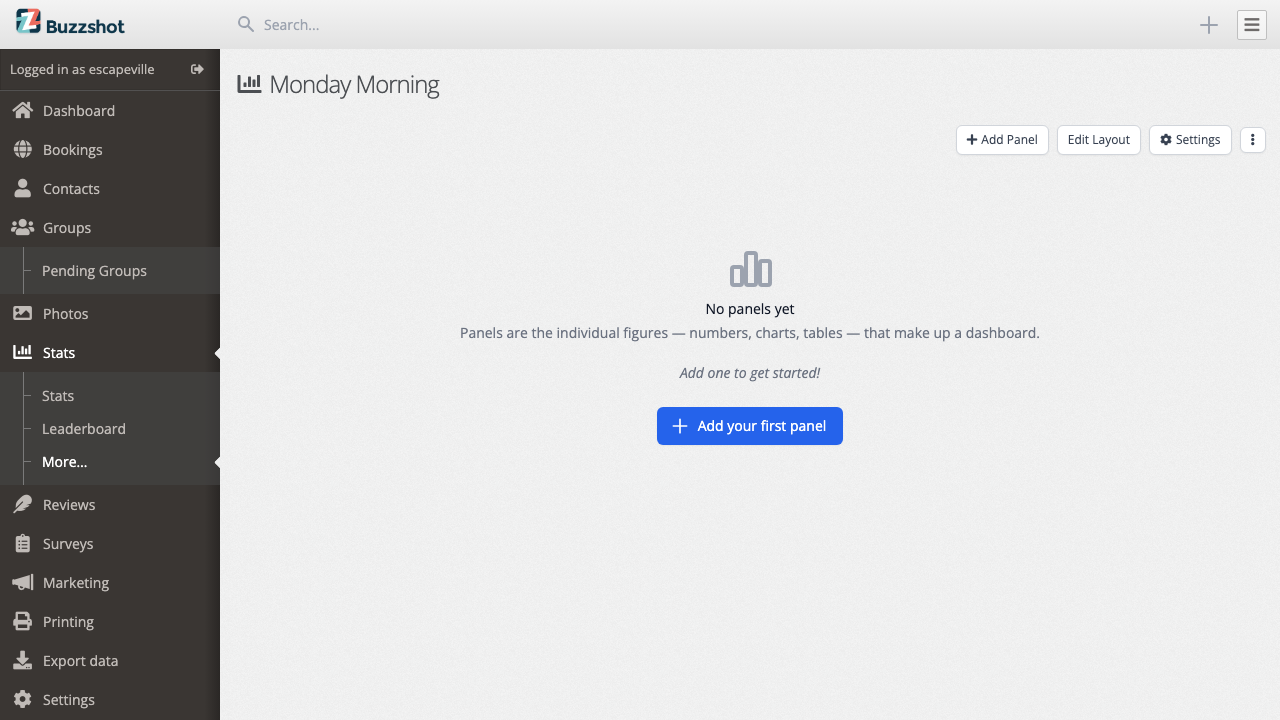
Add your first panel
Click Add Panel. The gallery opens.
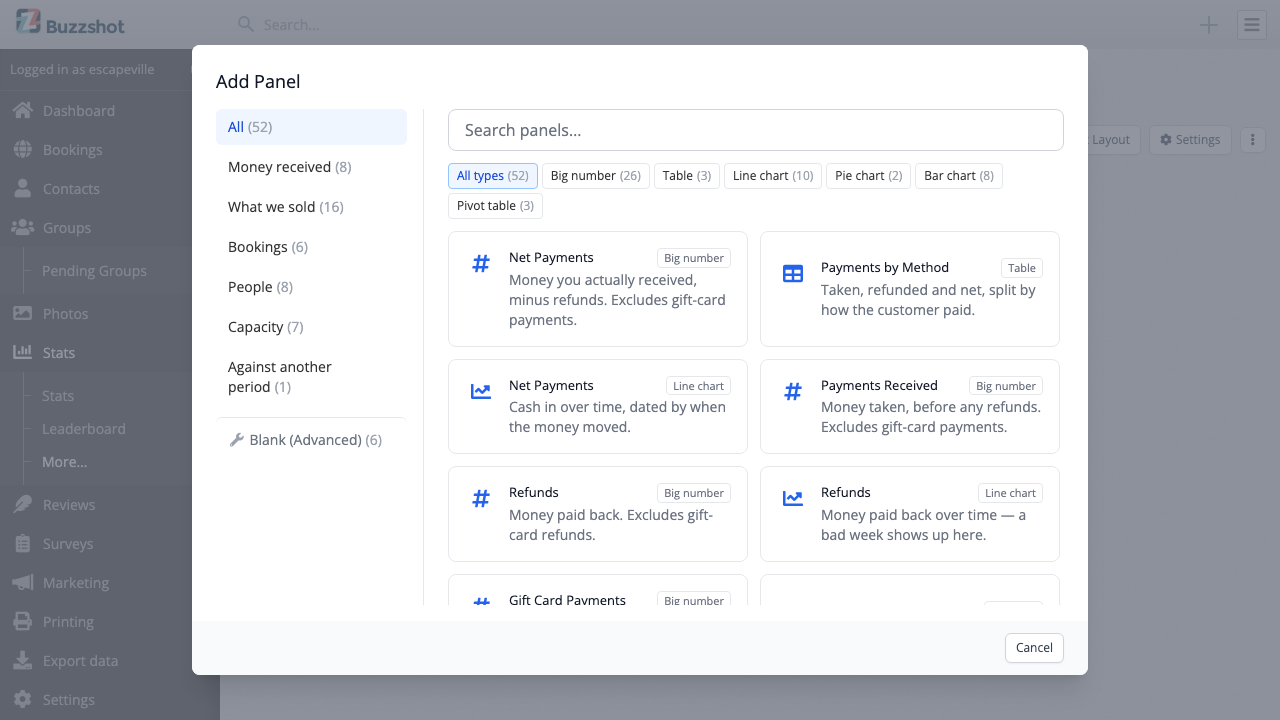
Use any combination of these filters:
- The categories down the left. Money received, What we sold, Bookings, People, Capacity and Against another period. All is selected at first and is often the quickest place to start.
- The search box. It covers every category and matches words that are not printed on the cards. Type "revenue", "utilisation", "AOV" or "pax" and it will still return the right panel.
- The shape buttons under the search box. Big number, Table, Line chart, Bar chart, Pie chart, Pivot table.
Some panels share a name. Occupancy appears three times, as a bar chart, a line chart and a grid. Each uses the same metric in a different shape. The card says which shape it uses.
Blank (Advanced) sits on its own at the bottom of the category list. Those six entries choose a shape and nothing else, then open the full editor. See Building a Panel from Scratch before using them.
Answering the panel's questions
Click a card. Most panels ask a question before they can be built.
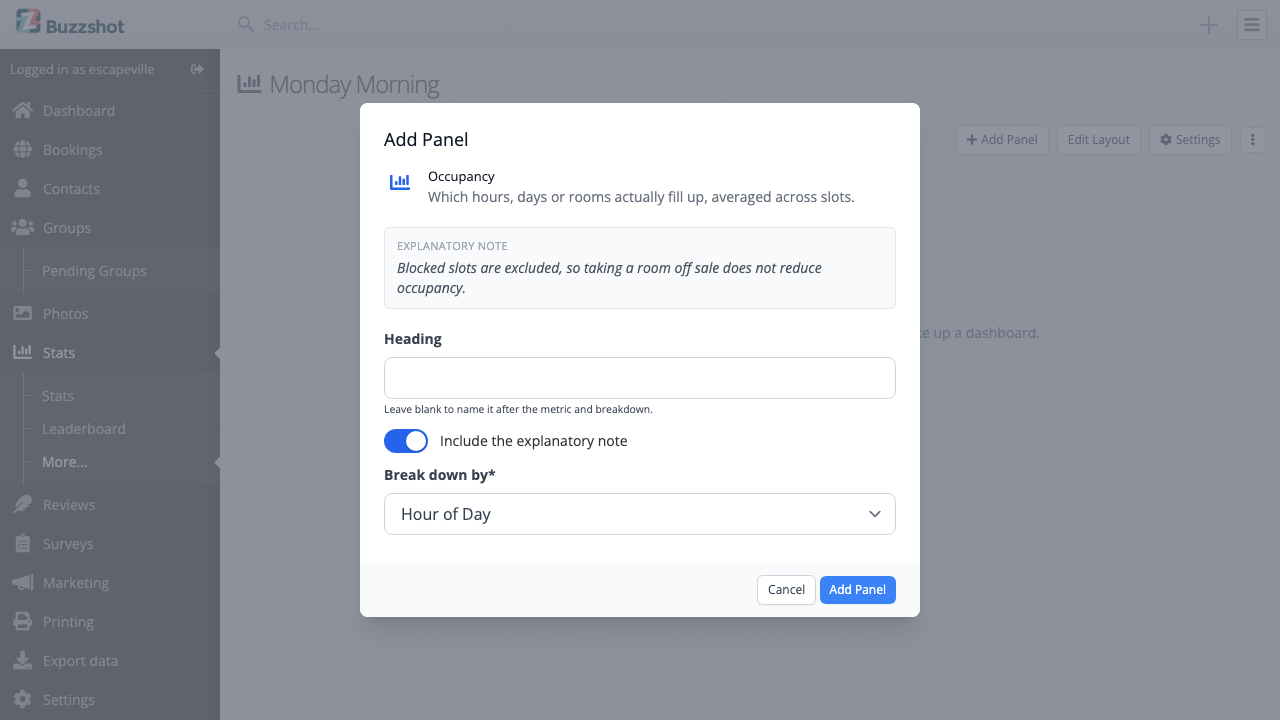
Take Occupancy as a bar chart. It asks Break down by: Hour of Day, Day of Week or Experience. Choose Day of Week and click Add Panel. The panel appears on the dashboard, showing how full you were on an average Monday, Tuesday and so on.
Panels may ask for:
- Heading. Leave it blank. The panel then names itself after the metric and the breakdown you chose ("Occupancy by Day of Week"). It tracks both, so changing the breakdown later also renames the panel. Enter a heading and that wording stays. Clear it to return to the automatic name.
- Break down by or Group by. This controls what runs along the bottom of a chart or down the side of a table. A chart over time asks for Day, Week or Month; a breakdown asks for Experience, Day of Week or Hour of Day.
- Rows and columns. Only grids ask this. They offer fixed pairs (Slot Time and Day of Week, Experience and Month and so on), not two free lists. The first runs down the side and the second across the top.
- Include the explanatory note. This is on by default. The note is the italic line under the finished panel that says what the number counts. You can read it beside the tickbox even when you turn it off.
A dashboard worth having
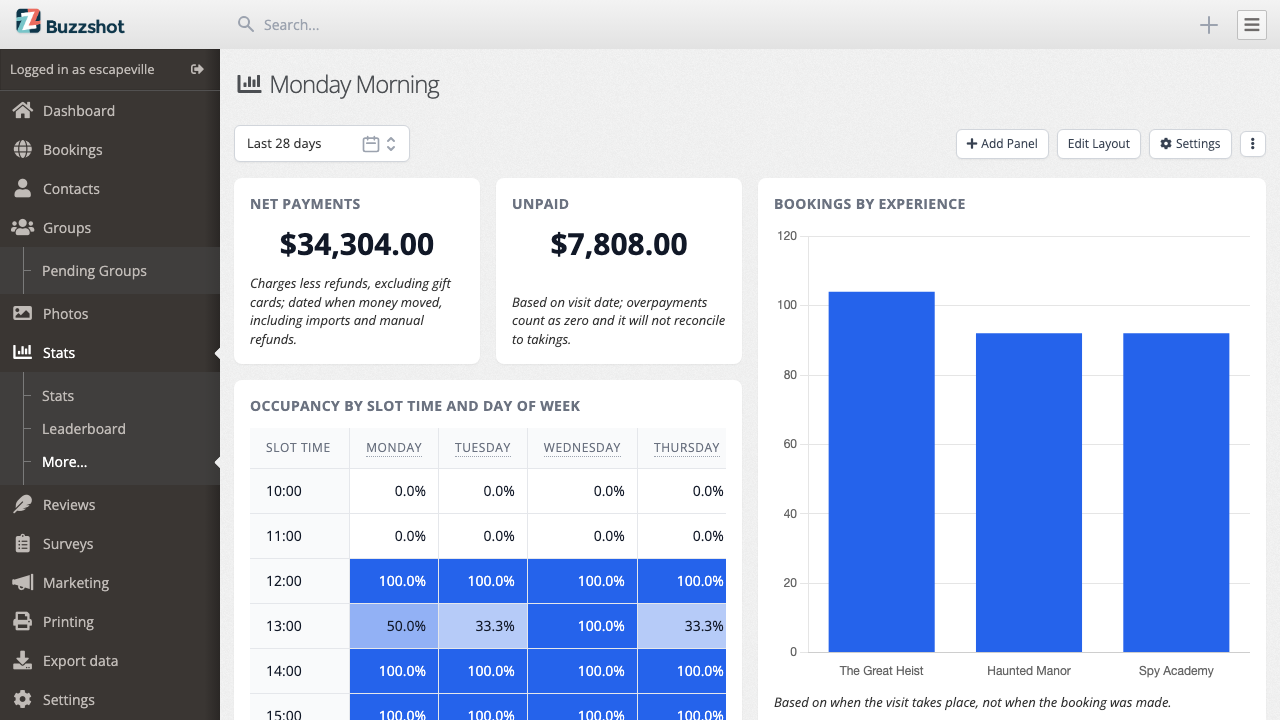
Four well-chosen panels can tell you more than twenty. A useful starting set for an escape room is:
- Net Payments as a big number. Money that actually reached you in the period.
- Bookings as a bar chart broken down by Experience. Which rooms are carrying the business.
- Occupancy as a grid, laid out by Slot Time and Day of Week. A heat map of your week. The pale corners are the slots to discount or drop.
- Unpaid as a big number. What is still owed on visits in the period.
Then add Period comparison to put the period against the same weeks last year. See Comparing Two Periods.
Changing a panel
Hover over a panel and click the ⋮ button in its corner.
- Edit Panel reopens the same questions you answered. Change the breakdown or the heading and save.
- Duplicate Panel copies it, note and size included, and drops the copy next to the original. To make a matching set, build Occupancy by Day of Week, duplicate it twice, and change the two copies to Hour of Day and Experience.
- Delete Panel removes it, after asking. It only appears once a dashboard has been changed, because a built-in's panels would come back on the next redraw anyway.
Moving panels about
Click Edit Layout at the top of the dashboard. Panels get drag handles. Drag to move them, drag a corner to resize, and click Save Layout when the page looks right. Cancel leaves the old arrangement alone.
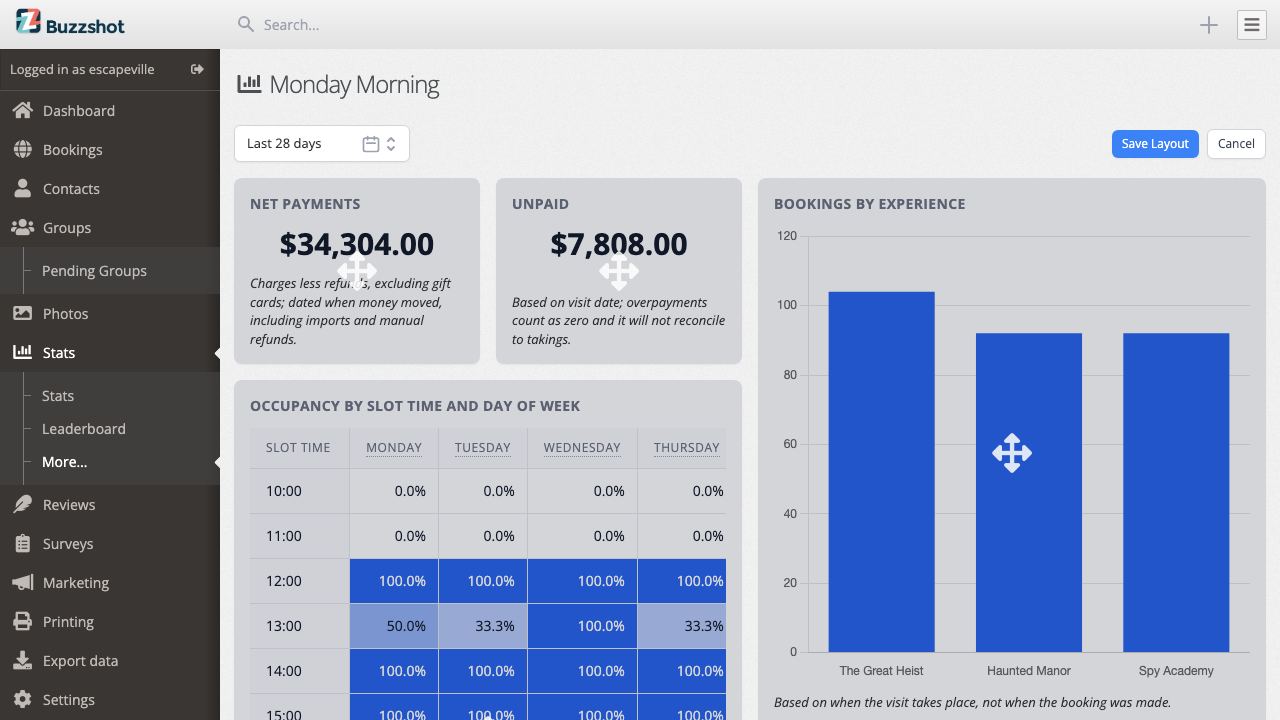
Panels start at a size that suits their shape. A big number is narrow and short, a table is wide, and a grid is wide and tall.
Starting over
Reset Dashboard, in the ⋮ menu at the top of the page, throws away every change to a built-in dashboard (panels, layout, colours and settings) and brings the original back. It only appears on a built-in, because only a built-in has an original to go back to.
A dashboard you made yourself has no reset. To undo everything, delete it from the ⋮ menu in the dashboards list and start again. Neither can be undone, so clone a dashboard before trying an experiment you may want to reverse.
When no ready-made panel fits
The gallery covers most questions that venues ask. It cannot cover a question specific to your business or filter the figures to one room or one product.
For that, open a Blank (Advanced) panel, or click Switch to advanced… inside any preset's edit window to take over the panel it built. Read Building a Panel from Scratch first: switching is a one-way door once you save.
See What the Numbers Mean for what each ready-made panel actually measures.