Dashboards: an Introduction
A dashboard puts numbers and charts about your business on one page. Buzzshot includes several ready-made dashboards, and you can build your own from ready-made panels.
You will find dashboards under Stats in the left-hand menu. Dashboards are only available if your account uses Buzzshot Bookings. If Stats takes you to a single page of old-style figures instead of a list of dashboards, that is why.
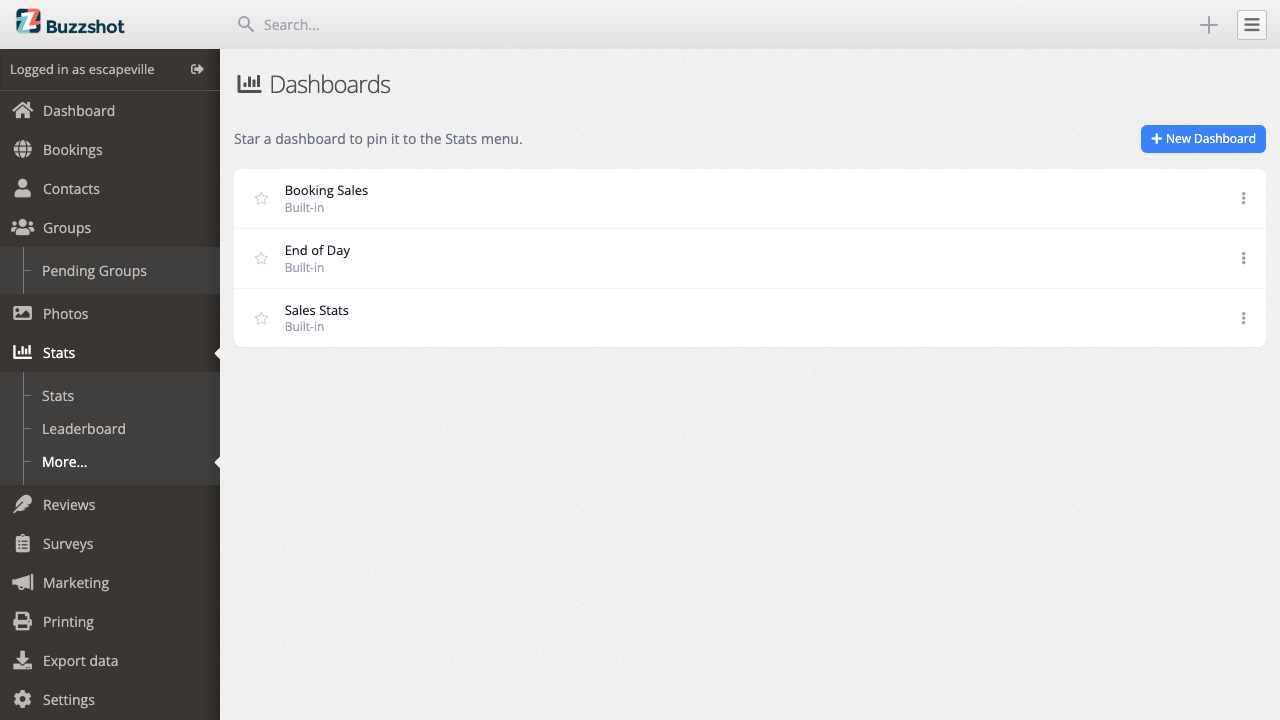
The dashboards you already have
Each one is marked Built-in. You can use it as it is, or copy it and make changes.
- Booking Sales answers "what did each room earn?". Totals for the period at the top (booking value, tax, fees and what is still unpaid), the same figures again for each room, a day-by-day breakdown, and a table of every confirmed booking at the foot.
- End of Day helps you cash up. The day's payments summarised by method, every booking taking place that day, and the ones that still owe money.
- Sales Stats is a quick look at recent trading: today's figures beside seven-day totals, this month against last month, and a day-by-day table under each.
Click a name to open it.
Choosing the dates
The date picker at the top left sets the period for every panel on the dashboard.
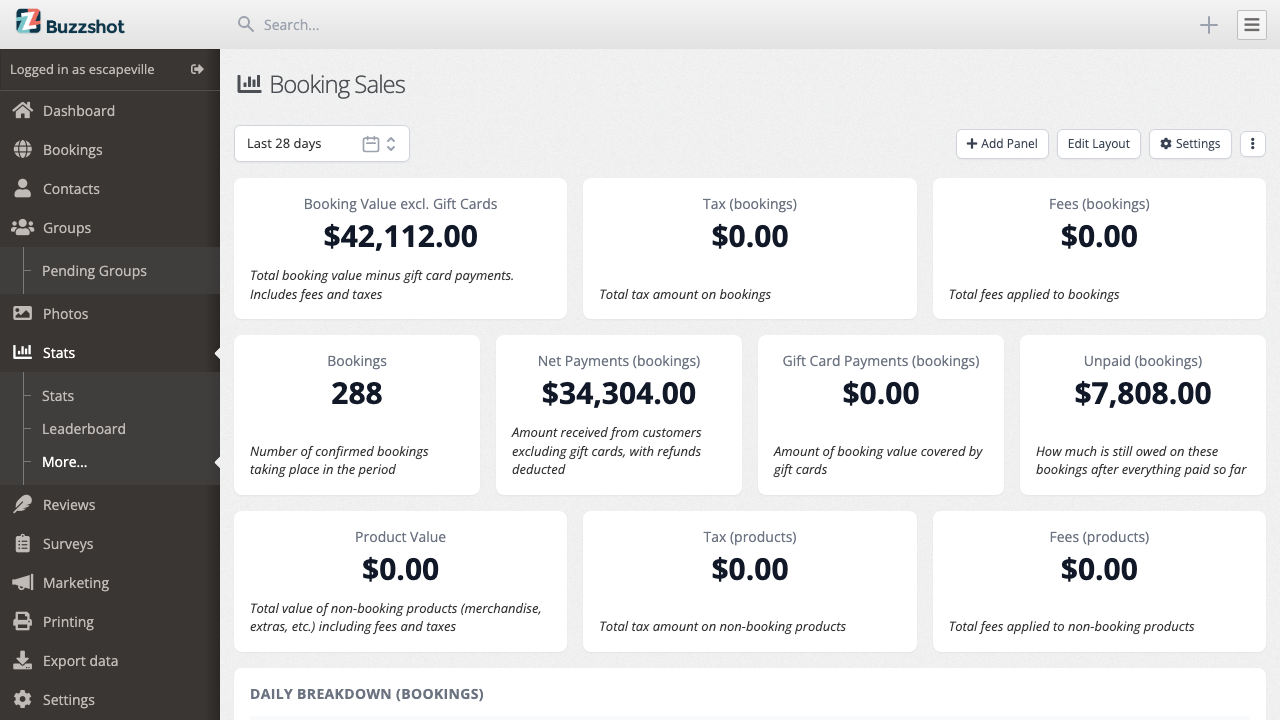
Change the dates and the whole page redraws. The period stays in the address bar, so you can bookmark that view or send someone a link to the same figures.
Each dashboard opens on its own default period. Booking Sales and End of Day both open on today. You can change that default: see Sharing a Dashboard.
A single panel can be pinned to its own period and ignore the picker. That is how Sales Stats shows today and the last seven days side by side, and why it has no date picker of its own.
Reading a panel
Every tile on the page is a panel. Most hold a heading and a figure: a number, a chart or a table. A few are a heading on their own, used to label a section. Some carry a short line of italic text underneath.
Read that line when it appears. It explains details that can change how you read the figure. For example, Unpaid is counted by the date of the visit, so it will never reconcile against the day's takings. Blocked slots are left out of Occupancy.
If two numbers disagree and you think they should not, the answer is nearly always in What the Numbers Mean.
Getting the data out
Hover over a panel and a ⋮ button appears in its top right corner.
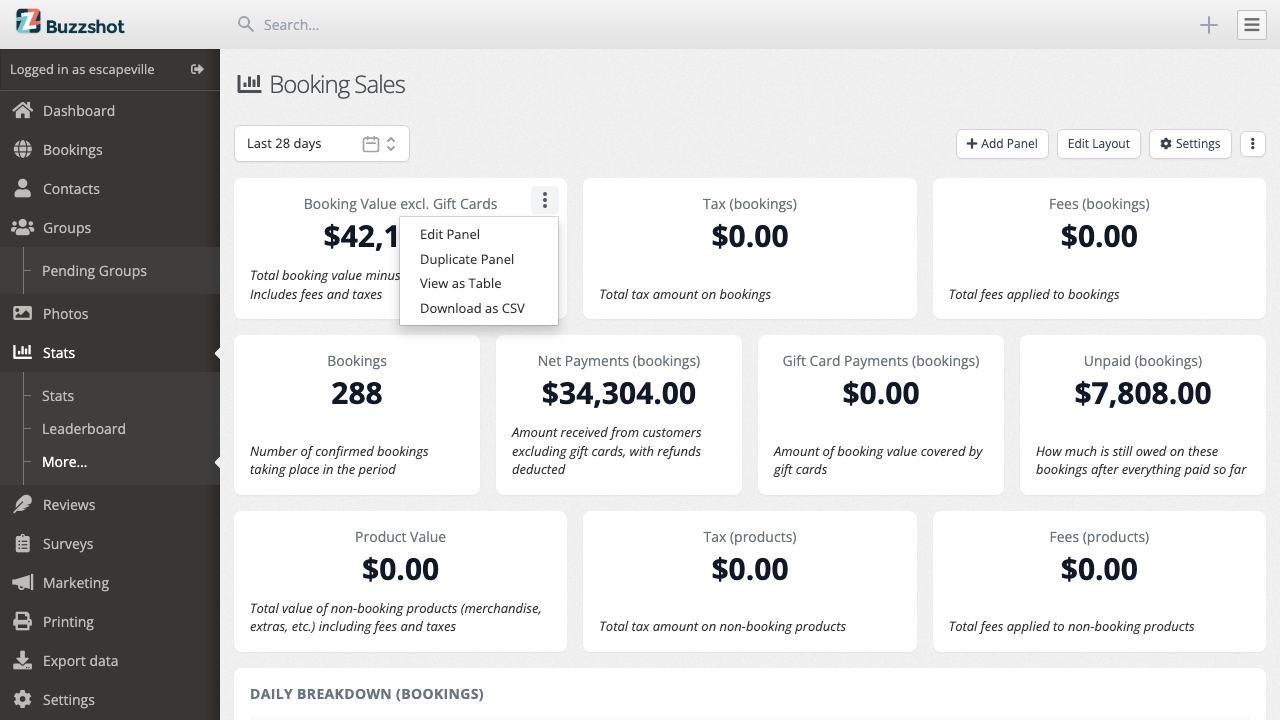
- View as Table shows a chart's underlying rows, including the exact figure behind a bar.
- Download as CSV downloads the panel's data for the period on screen, ready to open in a spreadsheet. A panel drawing more than one series gives you a zip with a file per series.
Neither changes the dashboard or its data. View as Table is not offered on a panel that is already a table, and a heading-only panel has nothing to give you.
Pinning a dashboard to the menu
The star to the left of each name in the list pins that dashboard to the Stats menu, putting it one click away from anywhere in Buzzshot. You can star as many as you like. More… at the foot of the menu takes you back to the full list.
Stars apply to the whole account, not just to you. Your colleagues see the same pinned dashboards. A dashboard shared across your organisation that you cannot edit has no star, so ask an organisation manager to pin that one.
Making one your own
- Use Clone in a dashboard's ⋮ menu in the list. Buzzshot creates a copy named after the original with "(copy)" on the end, which you can change freely.
- Change a built-in directly. Add a panel or move things about and Buzzshot keeps your version for this account. Reset Dashboard, in the ⋮ menu at the top of the page, discards your changes and restores the original.
Built-in dashboards cannot be deleted, only reset. Dashboards you create can be deleted from the ⋮ menu in the list.
To build one from nothing, see Creating a Dashboard.
Where to go next
- Creating a Dashboard: start a dashboard and fill it with ready-made panels.
- What the Numbers Mean: the difference between Net Payments, Amount Paid and Booking Value, and why two panels can both be right and still disagree.
- Building a Panel from Scratch: the full editor, for when no ready-made panel fits.
- Comparing Two Periods: this month against last month, or against the same weeks last year.
- Sharing a Dashboard: share links, colours, and dashboards that cover a whole organisation.
The Leaderboard, also under Stats, is a separate thing: a ranked table of teams by escape time. See Leaderboards.